Total Pageviews

Tuesday 28 November 2017

USING 40/100 MOVING AVERAGE FOR SHORT / MID / LONG TERM BUY-SELL ON CHART


USING 40/100 MOVING AVERAGE FOR SHORT / MID / LONG TERM BUY-SELL ON CHART
we will use moving average for it

SHORT TERM BUY SELL ON CHART - use 40 and 100 moving average as support / resistance for it on 60 min candle chart with stock price to moving average crossover and moving average crossover for entry and exit in three stages - 30 deg rise on daily chart

MID TERM BUY SELL ON CHART - use 40 and 100 moving average as support / resistance for it on DAILY  candle chart with stock price to moving average crossover and moving average crossover for entry and exit in three stages - 45 deg rise on daily chart

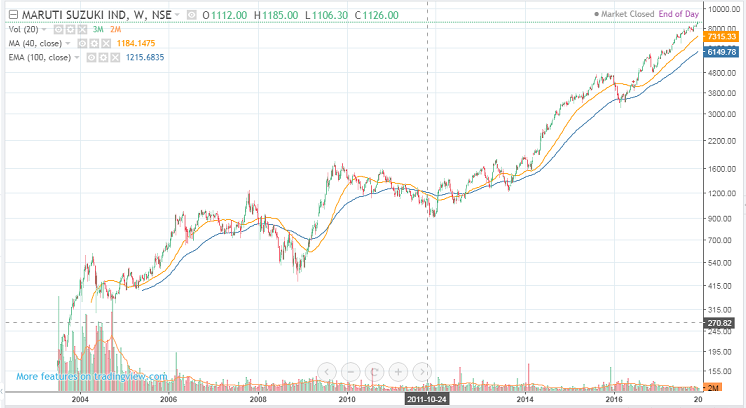
LONG TERM BUY SELL ON CHART - use 40 and 100 moving average as support / resistance for it on WEEKLY candle chart with stock price to moving average crossover and moving average crossover for entry and exit in three stages - 70 deg rise on daily chart


Market Movers by TradingView Quotes by TradingView

Thursday 23 November 2017

27-1 DEC - NIFTY support at 10300/350. for dual peak confirmation nifty needed to close below 10400.


27-1 DEC - NIFTY support at 10300/350. for dual rise end confirmation, nifty needed to close below 10400.


NIFTY  10390 -  10300/350 support , below 10400, double top will be confirm. for continues six days, market remains in 100 point trading range . S n P unchanged rating will lead huge selling by foreign investors on monday.


from recent high of NIFTY down 4%, it needs day close below 10070 . It will confirm falling trend move of nifty.

foreign investors selling with every rise in stock market. Strong dollar fails to break support at 64/65 in rupee. S n P unchanged rating will lead weak rupee above 66.
 -  Nifty call fair price is more than actual traded price (discount), whereas  
Nifty put option fair price is less than actual traded price (premium), thus trader are buying  put option and trader are selling call option for this month. Future open intrest rising due to short selling built up.

Gold is moving upward. first target is 42000.

Double Top, Eve and Adam 


UP STOCK/FUT - 207/21

SSLT VGUARD PATNI BANKNIFTY HDFCBANK SRF 
ZEEL SOUTHBANK JINDALSTEL BIOCON INFY 
TATAELXSI MRF DLF MCDOWELL-N BEL 
RAYMOND TVSMOTOR ADANIPOWER VOLTAS PCJEWELLER 

DOWN STOCK/FUT - 145/7
PVR COREPROTEC RELINFRA NAGARFERT 
COALINDIA CAIRN GODFRYPHLP 


STOCK/FUT STRONG BUY - above 50 SMA  & 200 SMA        - 949/119.   

STOCK/FUT BUY                  - below 50 SMA above 200 SMA - 183/39.  

STOCK/FUT SELL                - below 50 SMA  & 200 SMA         - 226/24.  

STOCK/FUT STRONG sell- below 200 SMA above 50 SMA  - 385/43.  


Thursday 16 November 2017

20-24 nov - 10250 support , weekly hammer, SELL ON NEWS

20-24 nov - 10250 support , weekly hammer, SELLING WITH GOOD NEWS

NIFTY  10283 - support at 10250, resistance at 10350 on hourly chart. see chart with cloud INDICATOR. 

NIFTY close below 4% from top (10070)  to be confirm down trend move trend.

foreign investors selling with every rise in stock market. Strong dollar fails to break support at 64/65 in rupee.

derivative-future-option -  Nifty call fair price is more than actual traded price (discount), whereas  
Nifty put option fair price is less than actual traded price (premium), thus trader are buying  put option and trader are selling call option for this month. Future open intrest rising due to short selling built up.

Gold is moving upward. first target is 42000.

any time frame, BUY entry,exit McClellan Oscillator. entry, exit  15  min chart for NIFTY.

any time frame BUY ENTRY EXIT McClellan Oscillator. ENTRY EXIT  15  min chart for NIFTY.


UP STOCK/FUT - 143/9

JUSTDIALSSLT PATNI ADANIENT SRF 
TATAELXSI TECHM VOLTAS DALMIABHA 

DOWN STOCK/FUT - 252/16
RNAVAL COREPROTEC SIEMENS MCX ITC 
BEML INDIACEM RPOWER RELINFRA CUMMINSIND FORTIS 
NAGARFERT RCOM CAIRN HCLTECH CAPF 


STOCK/FUT STRONG BUY - ABOVE 50 & 200 SMA - 866/111
STOCK/FUT BUY - BELOW 50 ABOVE 200 SMA - 264/46
STOCK/FUT SELL - BELOW 50 & 200 SMA - 206/19
STOCK/FUT STRONG SELL- BELOW 200 ABOVE 50 SMA - 484/49


NIFTY STOCK TREND N TARGET TILL YEAR END, SINCE 2018 TILL DATE WEEKLY

H O M E  COMMODIT Y STOCK RATING niftysamraat APP Signals OPTION MAGIC MUTUAL FUND V I D E O HOME 1 hindi NIFTYSAMRAAT Facebook ...